This is the 11 year story behind ChatStats
Today I released my first app, and while building it, I realized its development started 11 years ago. It wasn't at all like what it came to be, but the whole journey led me here. Today is launch day.
It all started on 2008, when me and my friends had been sending emails back and forth through a mailing list we had created the year before as a way for us to keep in touch after some of us graduated and moved away from our home city. We were 11 young men begining to experience adulthood in different cities throughout the country, there was a lot to talk about.
Be it for the novelty of adulthood, or just for trying to hang on to what was familiar, that group was a success. We were sending hundreds of emails every month (we even discovered Gmail had a cap of 100 messages before it started a new thread). So, one afternoon, while I was browsing through Google Groups admin page, I discovered it was possible to extract the number of emails each of us had sent every month since the group was created.
The group was only 17 months old, so as a gag for the group, I manually copied the data, month by month, and plotted a monthly curve of emails sent per person using Python and Cairo. The charts were pretty simple, but it did the job. The thread where the statistics were introduced grew for days.
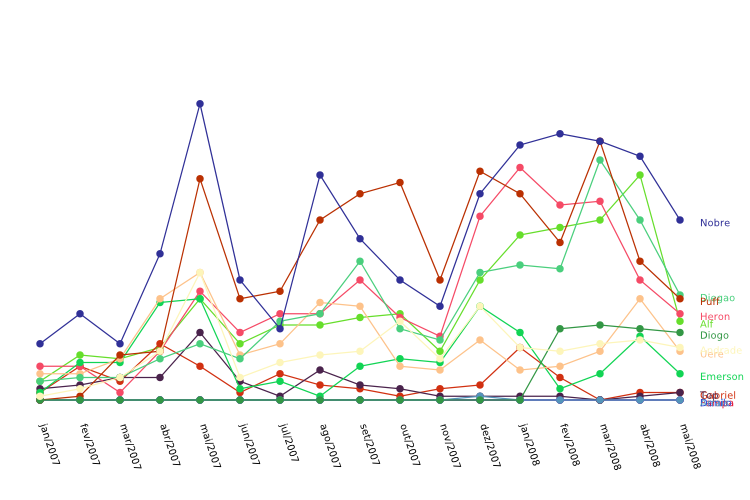
As most magazines and websites have figured out, it turns out people liked seeing data presented in an inviting way. I got really involved on charting with Python and Cairo, and ended up sharing everything as an open-source library named CairoPlot.
Time went by and, in 2011, WhatsApp exploded in Brazil. It felt like everyone was discovering the chat app together, we were creating new groups and finding new ways to interact and understand the new technology. Groups for everything were spawning and, somehow at that time, they ended up bringing people together rather than apart. (Good ol' days, huh?)
Like everyone else, I was also part of many of these new groups that year. By Christmas, one group decided to host a small gathering to celebrate the year we had spent together. While thinking about that, I decided to use our WhatsApp group chat history to create statistics and present them in an infographic.
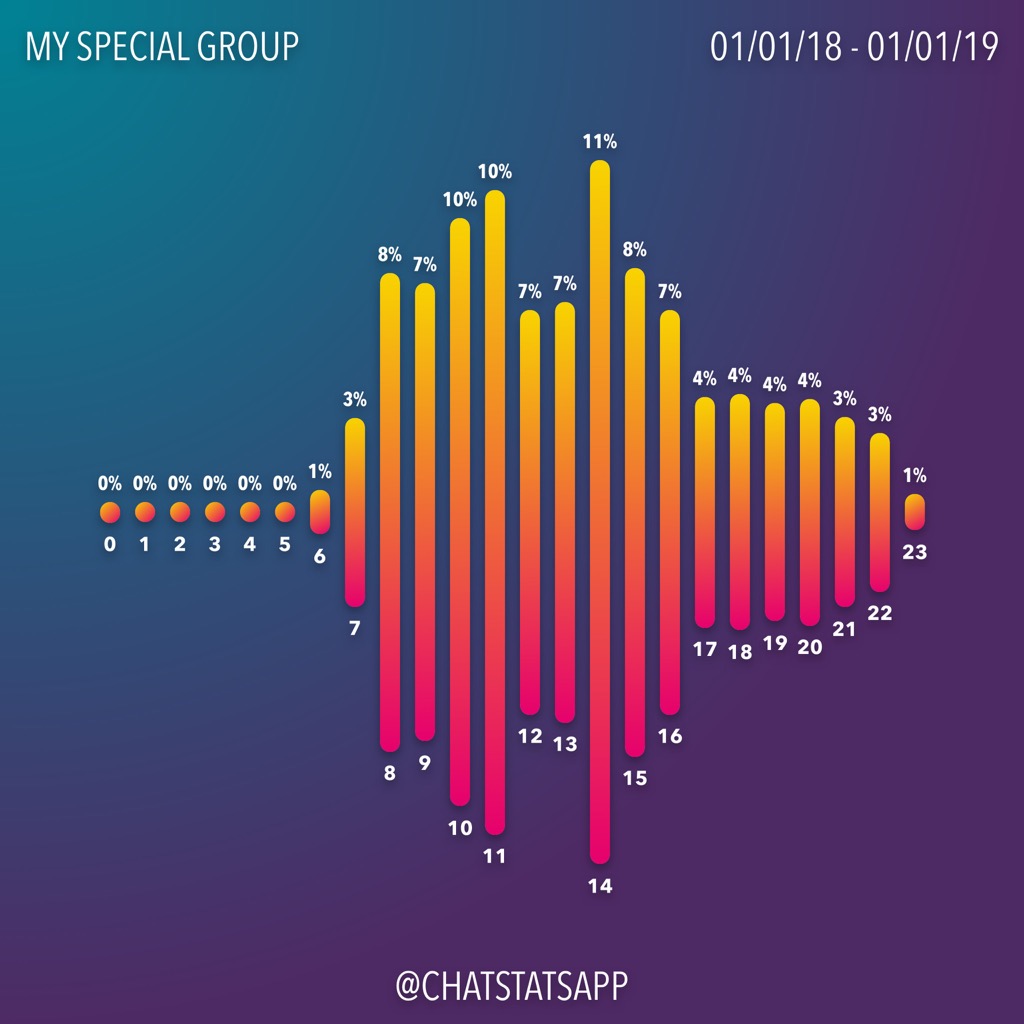
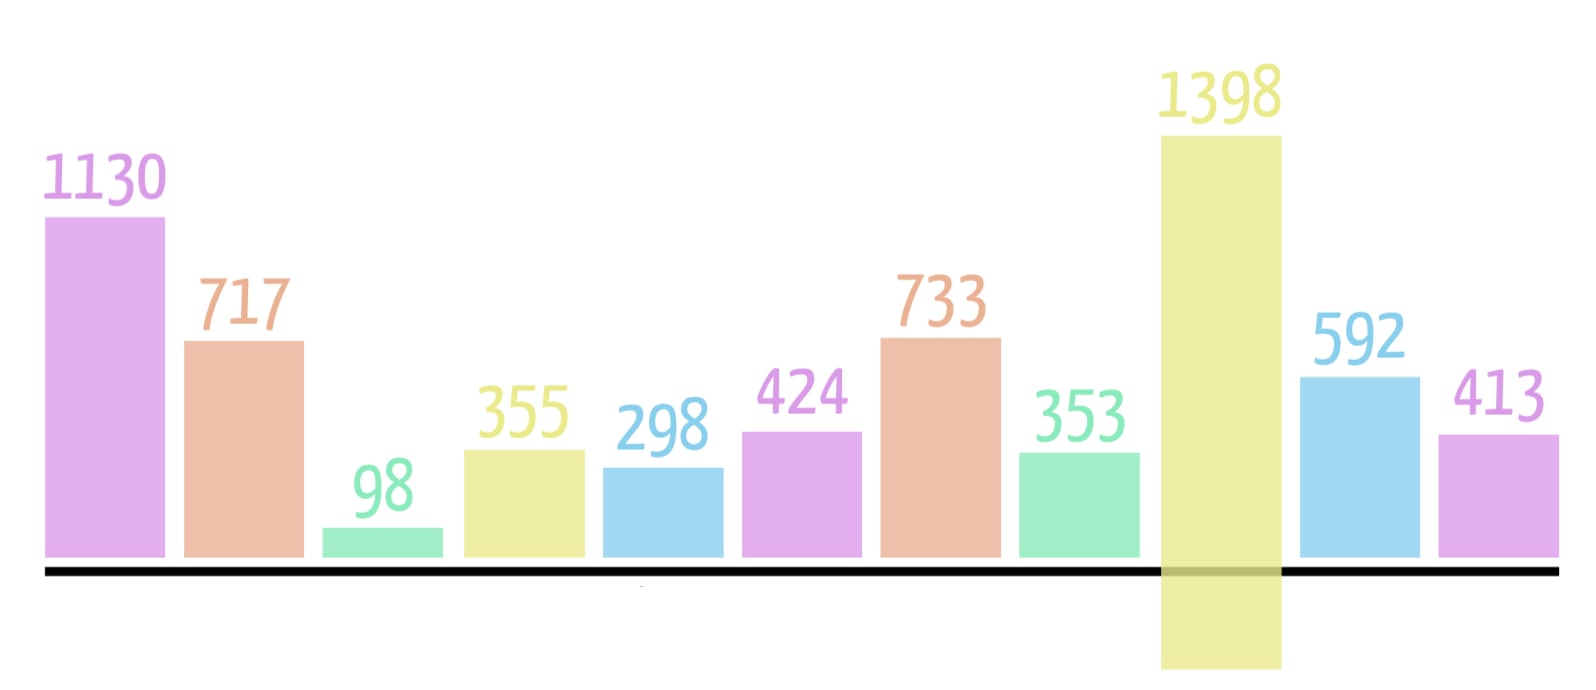
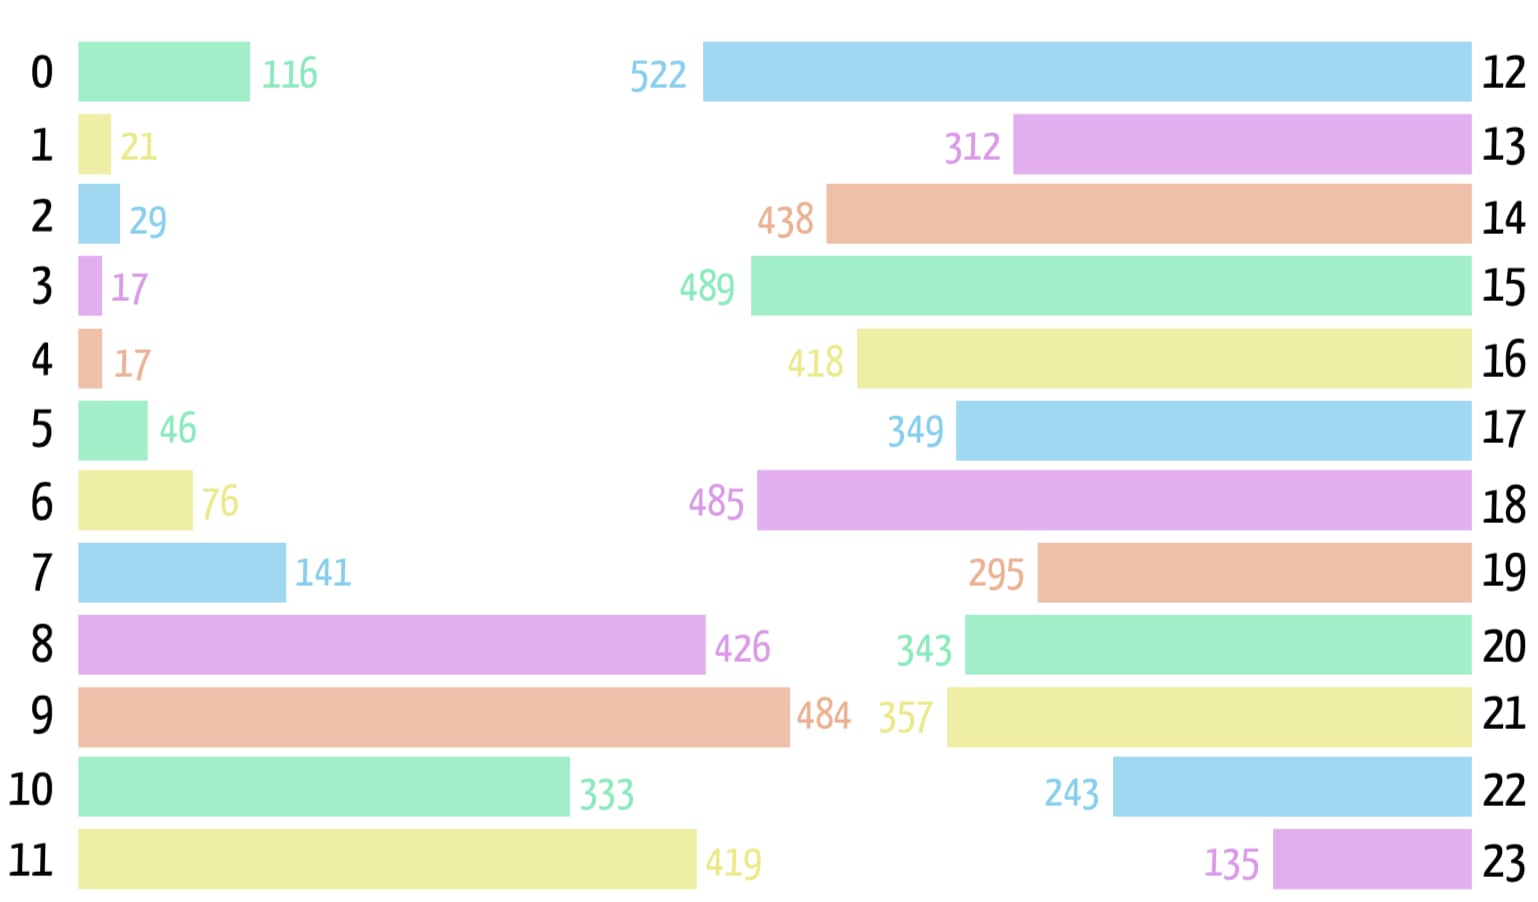
I used Python to count messages, plot the number of messages each day throughout the year and check who sent more messages each hour. Once again, it was well received.
That Python script was improved over time to be able to count pictures, videos, voice messages and characters. And, by 2015, I had been using it to send regular text statistics to my groups for a while. By the end of that year, at another gathering, came the next step: creating modular images to share the statistics. Those were handcrafted in Sketch and were the embryos of the images ChatStats generates today.
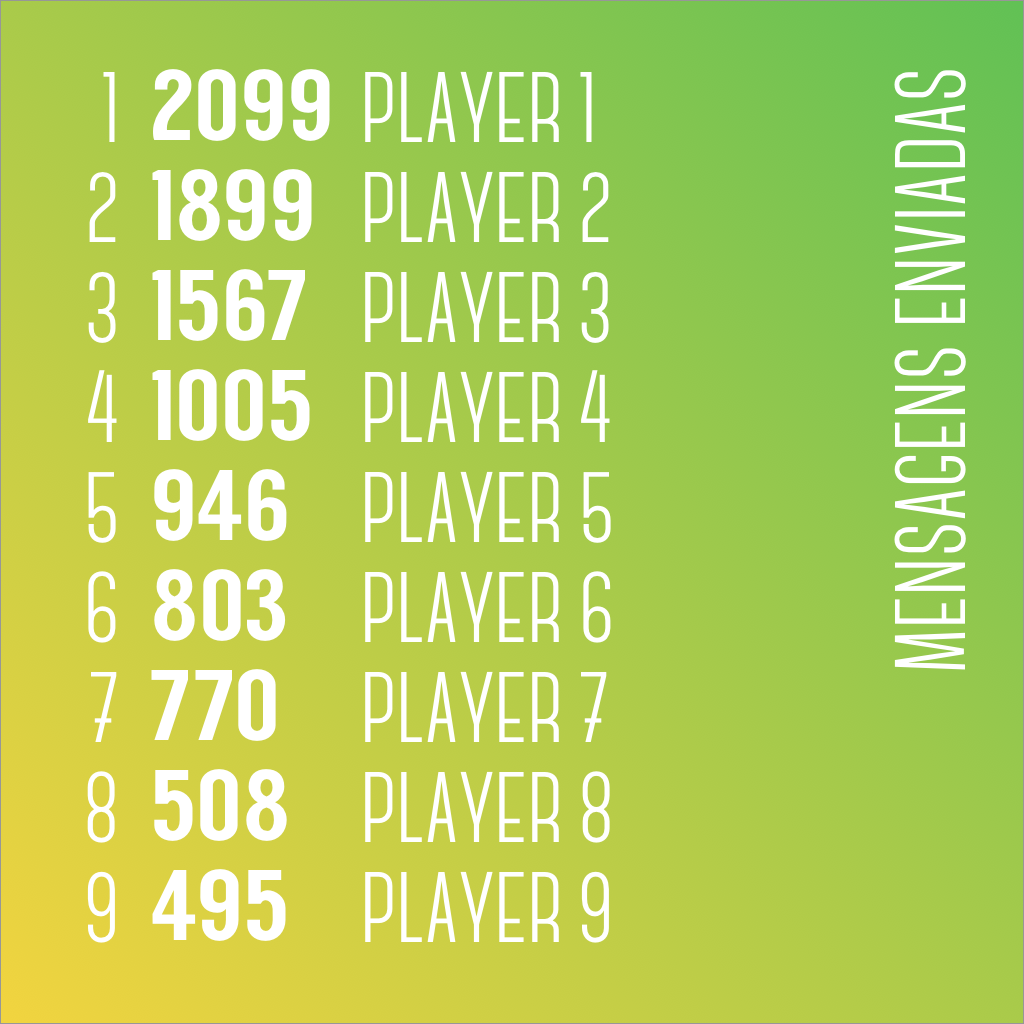
On 2016, I built a web service that received WhatsApp chats' history files via email and replied with automatically generated images. I even got around to writing the code for the top 10 texters in Python and Cairo, but the hurdles of charging for web services made me give up.
Fast forward to this year: 2019. In january, it dawned on me I could run that Python script from an iPhone through Pythonista and generate the text statistics a lot faster than what I had been doing. With that, I could send those to more groups, to the point I noticed there could be an opportunity there.
So, in February I sat down and wrote the proof of concept for ChatStats: an app that could import WhatsApp chats' history files, process them and generate a simple top 10. That first parser was an exact port from Python to Swift, but it did the job of exciting me.
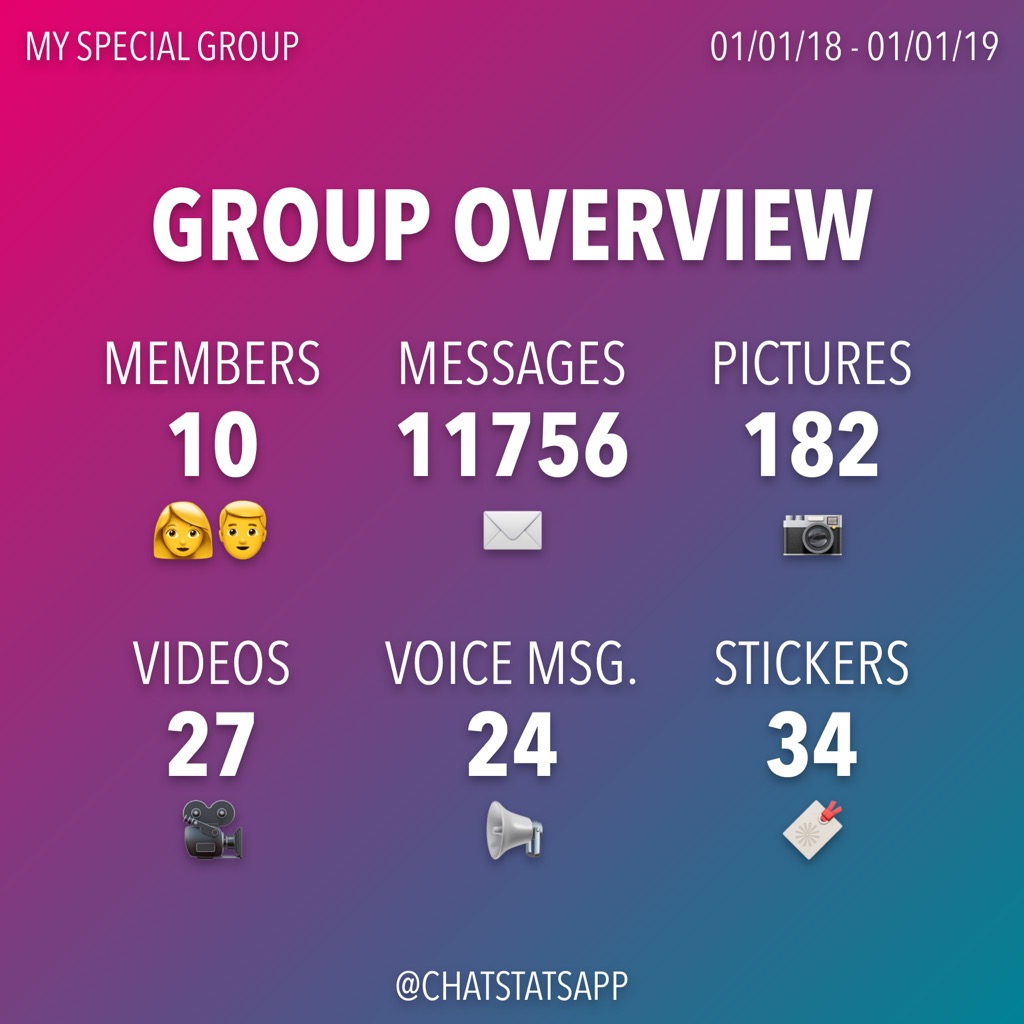
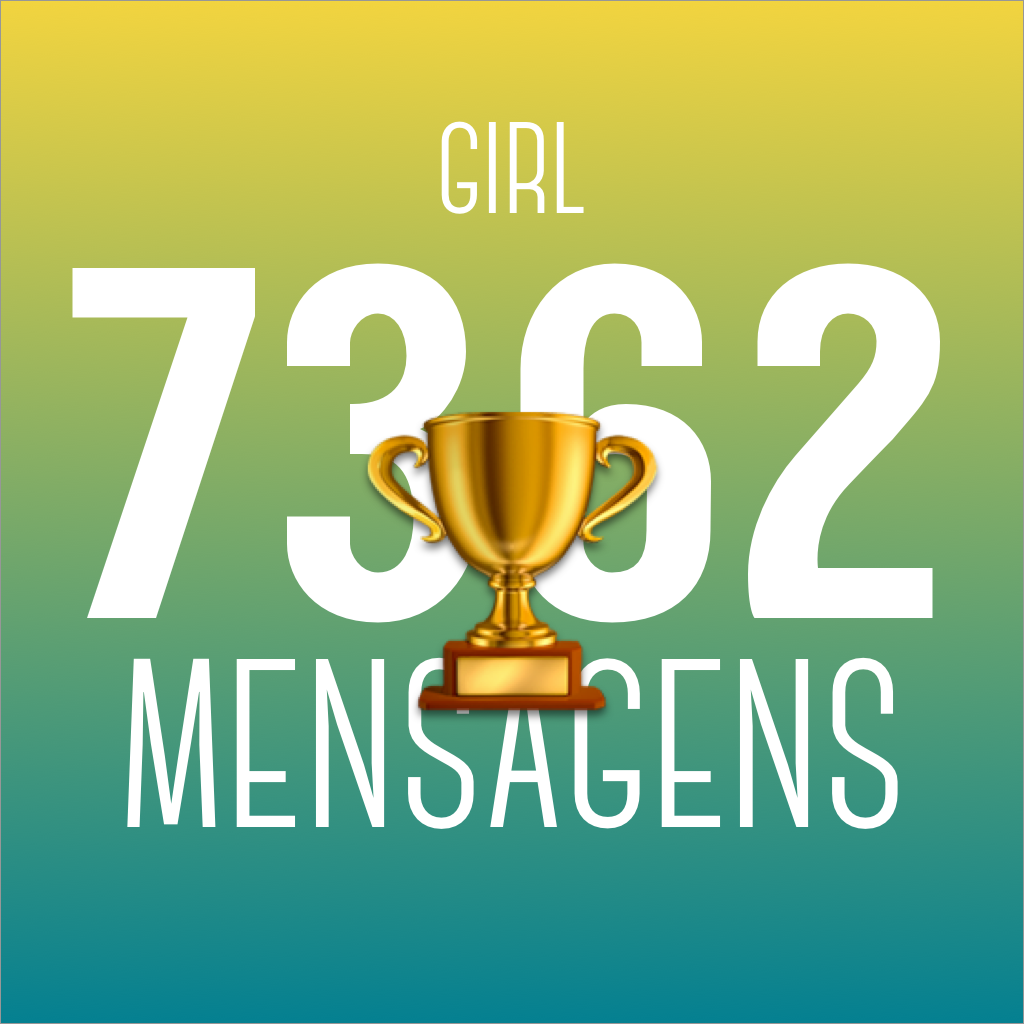
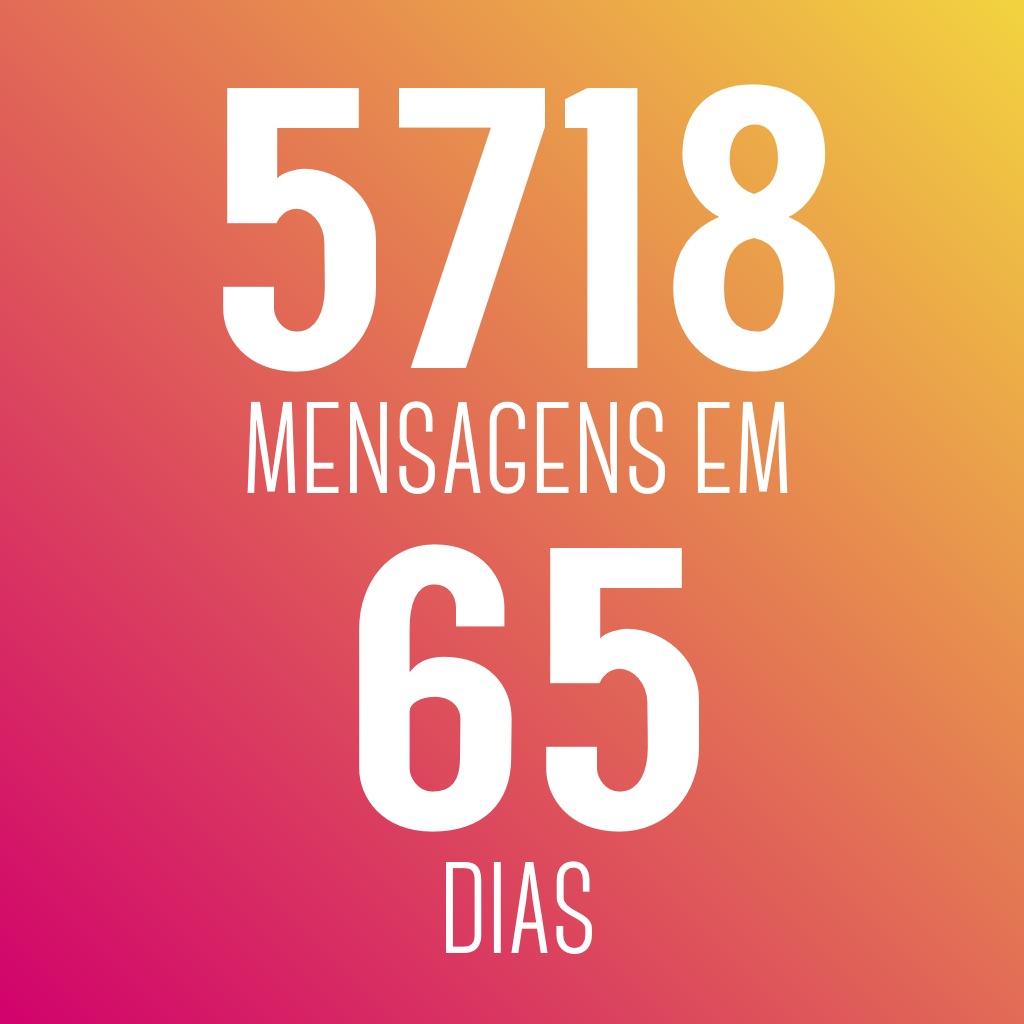
Steam picked up on the following weeks, to the point that I couldn't wait to get home from work to get back to ChatStats. I created ways to generate the rankings and champions images, and even added some new statistics, as the group overview, best day, hourly and weekly analysis. Now, ChatStats is ready for launch!
As I looked back at this 11 year journey, I noticed a lot has changed since those early days of sending e-mails. Personally, I've changed jobs and got married, but we changed a lot as a society also, as we got used to having super powerful computers in our pockets. As the second decade of this century comes to an end, our society is faced with questions about moderation and restraint on social networks, and I think ChatStats is aligned with what's coming.
I value privacy. A lot. So, ChatStats doesn't store any text the user imports from WhatsApp and thoroughly deletes everything it receives. Furthermore, everything runs locally and nothing is ever sent to any servers whatsoever.
Based on my personal experience developing and testing it, I think ChatStats will bring people closer as they realize how much they've been talking to each other, and it might also get us to reflect on how much we've been using this service.
I'll stop here, as I'm almost getting into what's coming on v2. It's launch day! ChatStats is ready for prime time and can generate up to 22 different images for WhatsApp groups, including hourly and weekly distributions of messages, champions and rankings for messages, characters, pictures, videos, voice messages, stickers, emojis and links, group interviews and best day analysis.
![]()
